ATR Range High/Low LevelsATR High/Low Levels Indicator - Detailed Description
Overview:
The ATR High/Low Levels Indicator is designed to help traders identify potential support and resistance levels based on the Average True Range (ATR). This indicator calculates and plots two key levels: the ATR High and ATR Low. These levels represent dynamic potential points of reversal or continuation, derived from the ATR, a volatility-based measure that reflects the degree of price movement in a given timeframe.
How It Works:
ATR Calculation:
- The ATR is calculated over a user-defined period (default is 14) using the selected timeframe (default is 1 day). The ATR measures the average range of price movement over the specified period, providing an indication of market volatility.
ATR High/Low Levels:
- ATR High Level: This is calculated by adding the ATR value to the closing price of the selected timeframe. It represents a potential resistance level.
- ATR Low Level: This is calculated by subtracting the ATR value from the closing price of the selected timeframe. It represents a potential support level.
Dynamic Plotting:
- The script dynamically plots lines for the ATR High and ATR Low levels on the chart. These lines can extend left, right, both, or none depending on user preferences, providing a visual guide for potential support and resistance.
Label Display:
- The indicator also displays labels for the ATR High and ATR Low levels, allowing traders to see the exact price values of these levels. These labels are positioned to the right of the current bar, ensuring clear visibility.
Customisation Options:
- Timeframe: Users can select the timeframe for ATR calculation (e.g., daily, weekly).
- Line Extension: Users can choose how the lines are extended: to the left, right, both, or not at all.
- Colour Customisation: Traders can customise the colour of the ATR High and Low lines and labels to match their chart's colour scheme.
- Label Offset: The position of the labels can be adjusted to the right of the current bar, providing flexibility in how they appear on the chart.
Trading Concepts:
- Volatility-Based Levels: The ATR High and Low levels provide insights into potential areas of market reaction. In volatile markets, these levels may serve as points where price may encounter resistance or support.
- Support and Resistance: The ATR High level can act as a resistance level where price might struggle to break above, while the ATR Low level can act as a support level where price might find a floor.
How to Use:
Identify Market Conditions: Use the ATR levels to gauge potential areas of interest on your chart. The ATR High level could indicate a resistance area, while the ATR Low level might suggest a support zone.
Entry and Exit Points: Traders can use these levels as reference points for entering or exiting trades. For example, consider shorting near the ATR High level in a downtrend or buying near the ATR Low level in an uptrend.
Combine with Other Indicators: For enhanced analysis, combine this indicator with other technical tools, such as moving averages, RSI, or MACD, to confirm potential trading signals.
Conclusion:
The ATR High/Low Levels Indicator is a versatile tool that leverages market volatility to highlight potential support and resistance levels. By providing a visual representation of these levels, it assists traders in making informed decisions based on price action and market dynamics. Whether you are trading trends, breakouts, or reversals, this indicator offers valuable insights into potential price levels where the market may react. Customise the settings to fit your trading style and integrate it into your overall trading strategy for better market analysis.
Cerca negli script per "high low"

Weekly & Daily High/Low AnalyzerOverview
The Weekly & Daily High/Low Analyzer indicator is designed to analyze the likelihood of achieving the High or Low of the day or week based on user-specified parameters. This tool is ideal for traders who want to identify potential turning points in the market by examining historical data.
Features
Weekly High/Low Analysis: Available exclusively on the daily timeframe, this feature allows users to analyze past weeks to determine the probability of reaching the weekly high or low. Users can specify the number of weeks to analyze via the "Number of Weeks to Calculate" input field. Setting this field to 0 includes all available historical data. Note that the current week is excluded from the analysis as it is incomplete, and weekends (Saturdays and Sundays) are not analyzed.
Daily High/Low Analysis: Available exclusively on the 1-hour timeframe, this feature analyzes past days to determine the probability of reaching the daily high or low. Users can specify the number of days to analyze via the "Number of Days to Calculate" input field. Setting this field to 0 includes all available historical data. The current day is excluded from the analysis as it is incomplete, and weekends (Saturdays and Sundays) are not analyzed.
Visualization
A table is displayed in the top right corner of the chart, showing the results of the analysis. The table highlights the hours or days with the highest probabilities in darker colors for easy identification.
How It Works
Weekly Analysis: On the daily timeframe, the script analyzes each week's high and low points. It differentiates between bullish and bearish weeks and calculates the probability of reaching the high or low on each day of the week (Monday to Friday).
Daily Analysis: On the 1-hour timeframe, the script examines the high and low points of each trading day. It differentiates between bullish and bearish days and calculates the probability of reaching the high or low at each hour of the trading day.
Inputs
Number of Weeks to Calculate: An integer input that determines the number of past weeks to include in the analysis. Setting this to 0 includes all historical data.
Number of Days to Calculate: An integer input that determines the number of past days to include in the analysis. Setting this to 0 includes all historical data.
Calculation and Display
The indicator uses arrays to count the occurrences of highs and lows on bullish and bearish weeks and days.
Probabilities are calculated and displayed in a table, with each row representing a day (for weekly analysis) or an hour (for daily analysis).
Colors in the table indicate the strength of the probability, making it easy to identify significant patterns.
Implementation
The script includes detailed logic for resetting values at the start of a new week or day, capturing opening and closing prices, and counting occurrences of highs and lows. The table displays data in a user-friendly format, with gradient colors indicating the probability strength.
Example Usage
Swing Traders: Can use the weekly analysis to identify potential high or low points for the week, aiding in setting entry or exit points.
Day Traders: Can use the daily analysis to determine the most likely hours for reaching the high or low of the day, optimizing intraday trading strategies.
Additional Information
This indicator is inspired by the knowledge shared by Omor and aims to provide traders with a statistical edge in predicting market movements.
Opening Range & Prior Day High/Low [Gorb]Introduction:
Opening Range & Prior Day High/Low indicator is an easy to use day traders tool. This indicator automatically plots the previous days high and low, as well as drawing a box from the opening range that the user specifies in the settings. These two together can help provide an indication of market sentiment and price trends for the day. They are often used as a trading strategy for day traders.
Overview:
The Opening Range , draws a box from the high to the low of the user defined time period and is extended until the end of the trading session. Most common are the 5/15/30min opening ranges.
Prior Day High/Low , draws lines from the previous days high and low that extend across the current session. These are used as support/resistance and also a marker to see market sentiment by crossing one of these levels.
The indicator is designed for all kinds of traders, offering a simple approach to automatically plot levels for you.
Features:
All skill-level friendly presets, easy to enable with one-click
Opening Range: Allows user to choose what time the range starts and ends to measure the high & low.
Extend Range Lines: allows the user to choose when the box stops extending according to the trading session time.
Enable Opening Range Box: allows the user to choose to plot the opening range or not.
ORB Border Color: allows the user to change the box border color.
ORB Box Shade Color: allows the user to change the background of the opening range box.
ORB Line Width: allows users to chose the width of the opening range box lines.
Enable Previous Day High: allows users to enable the previous days high to be plotted.
Enable Previous Day Low: allows users to enable the previous days high to be plotted.
Previous Day High Color: allows users to choose the color for this line.
Previous Day Low Color: allows users to choose the color for this line.
All colors are changeable for the user to customize to their liking.
Usage Demonstration
In the image below, we can see a basic example of how these 3 features function.
As explained above, the opening range is customizable to meet the users needs and can be disabled with one click. Same goes for the prior day high(green) and low(red) lines. All 3 are plotted each day automatically for the user if enabled.
In the image below, we can see an example of using the opening range break and prior day high together for a trading strategy.
This is a great example of using the prior day high with the opening range to use as a day trading strategy. It provides the trader with levels to watch for price to break out from for possible trade setups.
In this next image, we can see a failed breakdown from the opening range that results in a bullish breakout.
The first move was a fake breakdown with the failed rejection on the retest of the opening range lows. This led to a breakout above the range and a confirmation bounce on the breakout retest. Price did break above the prior day high and confirmed with a retest bounce on that level as well.
In the image below, we can see how previous days levels can act as resistance to use with the opening range.
Price didn't reject the opening range low, but it did reject the prior day high for the second time. This could be used as an entry or once price breaks down out of the opening range again.
Conclusion:
We believe in providing user-friendly tools to help speed up traders technical analysis and implement easy trading strategies. The goal is to provide a user-friendly indicator to automatically draw opening ranges and previous days levels to suit the users needs and trading style.
RISK DISCLAIMER
All content, tools, scripts & education provided by Monstanzer or Gorb Algo LLC are for informational & educational purposes only. Trading is risk and most lose their money, past performance does not guarantee future results.

Daily Monday Weekly Monthly Quarterly Yearly High Low Mid This indicator can be useful for traders who are interested in analyzing price movements over different time periods. By displaying the daily, Monday, weekly, monthly, quarterly, and yearly high and low values along with their mid values on a chart, traders can get a better understanding of how prices have behaved over longer periods of time.
For example, a trader might use this information to identify trends or patterns in the market. They might look for occasions when the daily high and low values move outside of an established range or when the weekly or monthly mid values cross certain key levels. This could signal a potential change in the market trend that the trader could act upon.
Additionally, the code can help traders identify key support and resistance levels based on the high and low values of the candles. By plotting these values on a chart, traders can see where prices tend to find support or resistance over different time periods. This information can be used to place stop loss orders or take profit orders at important levels.
Overall, the benefit of using the code you provided is that it offers traders a comprehensive view of price movements over different time periods, which can aid in making more informed trading decisions.
Each level described above has its own unique label, which is abbreviated for convenience. These abbreviations are listed below for quick reference:
For daily levels: DH (Daily High), DM (Daily Mid), and DL (Daily Low)
For Monday levels: MonH (Monday High), MonM (Monday Mid), and MonL (Monday Low)
For monthly levels: MH (Monthly High), MU50 (Monthly 50 percent of Mid and High), MM (Monthly Mid), MD50 (Monthly 50 percent of Mid and Low), and ML (Monthly Low)
For quarterly levels: 3MH (Quarterly High), 3MU50 (Quarterly 50 percent of Mid and High), 3MM (Quarterly Mid), 3MD50 (Quarterly 50 percent of Mid and Low), and 3ML (Quarterly Low)
For yearly levels: YH (Yearly High), YU50 (Yearly 50 percent of Mid and High), YM (Yearly Mid), YD50 (Yearly 50 percent of Mid and Low), and YL (Yearly Low)
These labels can help you quickly identify the different levels and keep track of important price points.
If the chosen timeframe does not fall under the category of intraday, daily and Monday level will not be displayed.
Please feel free to send your suggestions to @z_mehran.

Previous N Days/Weeks/Months High LowJapanese below / 日本語説明は下記
This indicator displays previous N days/weeks/months’ highs and lows simultaneously.
N is user input and users can separately input different N for highs and lows.
For instance, if you would like to show past 20days high and 10days low, you specify 20 for high and 10 for low.
Similar to highs and lows of yesterday, last week and last month which I previously developed a indicator for(see the link below), highs and lows of specific terms such as quarters are also respected as supports and resistances.
A legendary trader group, Turtles also uses 20days high/low break as one of their strategies.
Alerts can be set with the conditions below.
-Crossing over previous day’s high
-Crossing under previous day’s low
-Crossing over previous week’s high
-Crossing under previous week’s low
-Crossing over previous month’s high
-Crossing under previous month’s low
Please note that when we say past 2 days in this indicator, past 2days mean yesterday and day before yesterday, so “today” is not included as “today’s” high/low have yet to be fixed.
Related indicator: High/Low Yesterday&Last week&Last month&Last Year
By combining with this indicator, you can highlight important support and resistance.
—————————————————————
過去N日/N週間/Nヶ月の高値·安値を同時に表示することのできるインジケーターです。
Nはパラメーターとなっており、また高値と安値で異なる期間を指定することができます。
例えば、過去20日間の高値と過去10日間の安値という指定が可能です。
昨日、先週、先月の高値·安値と同様に、四半期などの過去一定期間の高値·安値はサポート·レジスタンスとして良く意識されます。
伝説のトレーダー集団タートルズも20日間の高値·安値のブレイクを取引ルールの一つとして使用していたことで有名です。
また、以下の条件でアラート設定が可能です。
-過去N日高値の上方ブレイク
-過去N日安値の下方ブレイク
-過去N週間高値の上方ブレイク
-過去N週間安値の下方ブレイク
-過去Nヶ月高値の上方ブレイク
-過去Nヶ月安値の下方ブレイク
このインジケーターで過去2日間の高値·安値といった場合、過去2日間とは昨日と一昨日の2日間を指します。まだ高値·安値の確定していない本日は含まないことに注意してください。
関連インジケーター: High/Low Yesterday&Last week&Last month&Last Year
当インジケーターと合わせて使用することで、主要なサポートレジスタンスを表示することができます。

Highs & Lows of Last [x] Bars===========
Highs & Lows of Last Bars
===========
We have found this indicator invaluable over the past few years - whether you prefer to trade Crypto, Forex, Commodities or something else this indicator could prove really useful. It's always nice to know the highs and lows of the last Week or Month, the problem being the information is only really relevant at the start or end of that chosen time period; throughout the mid-section of that time period the chart will either be displaying irrelevant information or info that has been/is being re-painted. Not good!
Our Highs & Lows of Last Bars Indicator will remove this re-painting problem and display up-to-date information from higher time frames without compromising the integrity of your current chart period.
-----------
Most high & low finder indicators will use, (for example), a 'W' or 'M' as their higher TF to get HTF results - we do things just a little bit differently, it's like this:
Most other High/Low Indicators:
~ MON 1st (get high/low value from 'W' TF) ~
~ MON 8th (get new data and plot from 'W' TF)
etc. - This leads to gaps in the data, re-painting and missing lots of potential mid-week trades.
Our High & Low of Last Bars:
~ MON 1st (get high/low value from LAST 7 DAYS) ~
~ TUE 2nd (get high/low value from LAST 7 DAYS) ~
etc.
This provides a much smoother High/Low plot with more relevant information. You can clearly see areas of support and resistance, updated on the LTF chart using data from a HTF.
Because we've included 2 TF's you can use simultaneously you can see when the lower TF touches the Higher TF this (generally, but not always!) means there's a breakout coming!
Hope this is useful to you guys!
Good Luck and Happy Trading!

Daily/Weekly Swing Highs-Lows + Candle PatternsDescription
Daily/Weekly Swing Highs-Lows + Candle Patterns
This indicator plots the most recent Daily and Weekly Swing Highs and Lows (key support/resistance levels) using a simple and effective logic: a swing high/low is confirmed when the previous bar's extreme is higher/lower than both the current and the one before it.
Features:
• Daily Swing Highs/Lows (teal/maroon circles) – toggleable
• Weekly Swing Highs/Lows (blue/purple circles) – optional
• Visual separators for new daily and weekly bars (light background color)
• Daily candle pattern labels (optional):
- US = Up Swing (strong bullish continuation)
- DS = Down Swing (strong bearish continuation)
- IN = Inside Bar
- OUT = Outside Bar
• Daily close position labels (optional):
- P = Positive (close in upper 25% of the range)
- mP = minor Positive (50–75%)
- mN = minor Negative (25–50%)
- N = Negative (lower 25%)
All elements are fully customizable (colors, visibility) and work on any timeframe.
Best suited for intraday timeframes (1 min to 4 hours) where daily and weekly key levels provide important context for price action and reversals.
The optional "Trading session length" input is mainly useful for markets with shorter sessions (e.g., European indices) and does not affect swing detection.
Open-source, free to use and modify.
How to Use the Indicator + Practical Use Case
Key Settings (Inputs)
Trading session length (hours) → Default 8.5 h (useful for FTSEMIB, DAX, etc.). Leave it as is unless you trade a market with a different session length.
Daily Swing Levels → Show/Hide daily swing highs (teal) and lows (maroon).
Weekly Swing Levels → Usually keep off on intraday charts to avoid clutter (turn on for higher-timeframe context).
Daily Candle Patterns → Enable only if you want to see US/DS/IN/OUT labels on the daily close.
Close Position (P/mP/mN/N) → Enable if you want to quickly see how strong/weak the daily close was.
What You See on the Chart
Teal circles = Last confirmed daily swing high (resistance).
Maroon circles = Last confirmed daily swing low (support).
Blue/purple circles (if enabled) = Weekly swing high/low.
Light gray background = Start of a new trading day.
Purple background (if weekly enabled) = Start of a new week.
Small labels on daily close (if enabled):
- US = strong bullish day
- DS = strong bearish day
- IN = inside bar (consolidation)
- OUT = outside bar (expansion)
- P/mP/mN/N = how far the close was from the high/low of the day.
Best Timeframes 1 min to 240 min charts → Daily levels act as major support/resistance zones for intraday trading.
Avoid using on daily or higher charts (the logic is designed for intraday context).
Why this works well intraday:
The daily swing high/low levels are high-probability zones where institutions and algorithms often defend positions. On intraday charts, they act as “magnets” for price, giving you clean entries and exits with clear invalidation levels.
This indicator keeps your chart clean while providing exactly the context most intraday traders need: key daily levels + daily momentum context.

Quantura - Session High/LowIntroduction
“Quantura – Session High/Low” is a professional-grade session mapping indicator that automatically identifies and visualizes the highs, lows, and ranges of key global trading sessions — London, New York, and Asia. It helps traders understand when and where liquidity tends to accumulate, allowing for better market structure analysis and session-based strategy alignment.
Originality & Value
This indicator unifies the three most influential global sessions into a single, adaptive visualization tool. Unlike typical session indicators, it dynamically updates live session highs and lows in real time while marking session boundaries and transitions. Its multi-session management system allows for immediate recognition of overlapping liquidity zones — a crucial feature for institutional and intraday traders.
The value and originality come from:
Real-time tracking of session highs, lows, and developing ranges.
Simultaneous visualization of multiple global sessions.
Optional vertical range lines for clearer visual segmentation.
Customizable session times, colors, and time zone offset for global accuracy.
Automatically extending and updating lines as each session progresses.
Functionality & Core Logic
Detects the start and end of each trading session (London, New York, Asia) using built-in time logic and user-defined UTC offsets.
Initializes session-specific high and low variables at the start of each new session.
Continuously updates session high/low levels as new candles form.
Draws color-coded horizontal lines for each session’s high and low.
Optionally adds vertical dotted lines to visually connect session range extremes.
Locks each session’s range once it ends, preserving historical structure for review.
Parameters & Customization
New York Session: Enable/disable, customize time (default 15:30–21:30), and set color.
London Session: Enable/disable, customize time (default 09:00–16:30), and set color.
Asia Session: Enable/disable, customize time (default 02:30–08:00), and set color.
Vertical Line: Toggle dotted vertical lines connecting session high and low levels.
UTC Offset: Adjust session timing to align with your chart’s local time zone.
Visualization & Display
Each session is color-coded for quick identification (default: blue for London, red for New York, green for Asia).
Horizontal lines track evolving session highs and lows in real time.
Once a session closes, the lines remain fixed to mark historical range boundaries.
Vertical dotted lines (optional) visually connect the session’s high and low for clarity.
Supports full overlay display without interfering with other technical indicators.
Use Cases
Identify liquidity zones and range extremes formed during active trading sessions.
Observe session overlaps (London–New York) to anticipate volatility spikes.
Combine with volume or market structure tools for session-based confluence.
Track how price interacts with prior session highs/lows to detect potential reversals.
Analyze session-specific performance patterns for algorithmic or discretionary systems.
Limitations & Recommendations
The indicator is designed for intraday analysis and may not provide meaningful output on daily or higher timeframes.
Adjust session times and UTC offset based on your broker’s or exchange’s timezone.
Does not provide trading signals — it visualizes session structure only.
Combine with liquidity and volatility indicators for full contextual understanding.
Markets & Timeframes
Compatible with all asset classes — including crypto, forex, indices, and commodities — and optimized for intraday timeframes (1m–4h). Particularly useful for traders analyzing session overlaps and volatility transitions.
Author & Access
Developed 100% by Quantura. Published as a Open-source script indicator. Access is free.
Compliance Note
This description fully complies with TradingView’s Script Publishing Rules and House Rules . It provides a detailed explanation of functionality, parameters, and realistic use cases without making any performance or predictive claims.

Killzones High/Low [FD] - ITADESCRIPTION ENGLISH - ITALIAN
Killzones High/Low - ITA - Indicator Description
Advanced Pine Script v5 indicator designed for ICT (Inner Circle Trader) strategies that identifies trading killzones, key support/resistance levels and midnight prices with granular controls for every element.
SETTINGS
General controls that affect all indicator elements:
Session Drawings Limit (1): Determines how many historical sessions to keep on chart for each element type. Higher values show more history but may slow performance
Timeframe Limit (30): Drawings disappear on timeframes equal or higher to avoid visual overload
Time Zone: Select reference timezone for sessions. America/New_York automatically adjusts for daylight saving, GMT options are fixed
Label Size: Controls global size of all labels (from Tiny to Huge)
Drawings Cutoff Time: Stops extension of all pivots at specified time (useful for end of trading day)
KILLZONES
Manages critical trading sessions with colored boxes and pivot lines:
General Controls
Show Boxes/Text: Enables visualization and texts in session boxes
Transparency: Controls opacity of boxes and text (0=opaque, 100=transparent)
Available Sessions
Five configurable sessions with individual controls for enabling, custom text, times and colors:
Asia (18:00-00:00): Blue by default
London (02:30-05:30): Red by default
N.Y. AM (07:00-11:30): Green by default
Lunch (11:30-13:00): Golden yellow, enabled by default
N.Y. PM (13:00-16:00): Purple by default
PDH / PDL
Manages Previous Day High and Previous Day Low levels:
Show PDH/PDL: Enables previous day's maximum/minimum
Extension: "Until Mitigation" (stops when broken) or "Most Recent Candle" (continues always)
Colors/Thickness: Visual customization of lines (dark purple by default, 1px thickness)
Labels: Shows "PDH"/"PDL" texts with customizable color (white by default)
PWH / PWL
Manages Previous Week High and Previous Week Low levels:
Show PWH/PWL: Enables previous week's maximum/minimum
Extension: Independent control of line extension
Colors/Thickness: Orange by default for both, 2px thickness
Labels: Configurable "PWH"/"PWL" texts
PMH / PML
Manages Previous Month High and Previous Month Low levels:
Show PMH/PML: Enables previous month's maximum/minimum using security()
Extension: Independent control like other systems
Colors/Thickness: Blue by default for both, 1px thickness
Labels: Customizable "PMH"/"PML" texts
MIDNIGHT PRICE LEVEL
Advanced system for multiple midnight prices:
Base Controls
Show Midnight Price: Enables line at pre-00:00 closing price (ICT strategy)
Midnight -2/-3 Days: Extends system to 2 and 3 days prior
Extension/Mitigation: "Until Mitigation" or "Most Recent Candle" with "Once" or "Multiple" mode
Customization
Separate Colors: D-1, D-2, D-3 with progressive transparency (gold by default)
Style/Thickness: Customizable lines (Solid, Dotted, Dashed)
Labels: Configurable texts (🌙1, 🌙2, 🌙3) with customizable background/text colors
Alerts: Alerts when mitigated during active killzones
KILLZONE LEVEL
Controls pivot lines and killzone labels:
Line Controls
Show Lines: Enables horizontal lines on killzone highs/lows
Break Alerts: Alerts when pivots are exceeded
Midpoints: Dashed lines at range center with stop option after mitigation
Label Offset: Moves labels ahead by 5 candles (0-20 configurable), rejoining when mitigated
Label Controls
Text Customization: Configurable labels for each session (Asia_H/L, London_H/L, etc.)
Background/Colors: Transparent or visible labels with customizable colors
Broken Labels: Additional text (❌ by default) and special colors when pivots mitigated
Extension: "Until Mitigation" or "Beyond Mitigation" with session filter ("Most Recent" or "All")
LABEL STYLES
Four dedicated sections to customize label graphic shapes:
Killzone Line Label Styles: Separate controls for killzone High/Low
PDH/PDL Label Styles: Customizable shapes for Previous Day levels
PWH/PWL Label Styles: Customizable shapes for Previous Week levels
PMH/PML Label Styles: Customizable shapes for Previous Month levels
Each section offers 15+ shape options (Arrows, Center, Circle, Square, Diamond, Triangles, Crosses, Flags, etc.)
MIDNIGHT LINES
System for vertical lines at 00:00:
Show Lines/Labels: Vertical lines with upward arrow labels
Customization: Color (gray by default), style, thickness of vertical lines
Labels: Configurable text ("00:00" by default) with customizable text color (black by default)
Label Offset: Percentage control (-10000% to +10000%) for vertical positioning
Extension: Configurable directions (None, Above, Below, Both)
Limit: Maximum number of lines maintained (4 by default, max 50)
The indicator offers granular control over every visual and functional aspect, making it possible to adapt it to any ICT trading strategy or personal setup.
---ITALIANO---
Killzones High/L ow - ITA
Indicatore avanzato per Pine Script v5 progettato per strategie ICT (Inner Circle Trader) che identifica killzones di trading, livelli chiave di supporto/resistenza e prezzi di mezzanotte con controlli granulari per ogni elemento.
IMPOSTAZIONI
Controlli generali che influenzano tutti gli elementi dell'indicatore:
-Limite Disegni Sessione (1): Determina quante sessioni storiche mantenere sul grafico per ogni tipo di elemento. Valori più alti mostrano più cronologia ma possono rallentare le prestazioni
-Limite Timeframe (30): I disegni scompaiono su timeframe uguali o superiori per evitare sovraccarico visivo
-Fuso Orario: Seleziona il fuso di riferimento per le sessioni. America/New_York si regola automaticamente per l'ora legale, le opzioni GMT sono fisse
-Dimensione Etichette: Controlla la dimensione globale di tutte le etichette (da Minuscola a Enorme)
-Orario Limite Disegni: Ferma l'estensione di tutti i pivot all'orario specificato (utile per fine giornata di trading)
KILLZONES
Gestisce le sessioni di trading critiche con riquadri colorati e linee pivot:
Controlli Generali
-Mostra Riquadri/Testo: Abilita visualizzazione e testi nei riquadri delle sessioni
-Trasparenza: Controlla opacità di riquadri e testo (0=opaco, 100=trasparente)
Sessioni Disponibili
Cinque sessioni configurabili con controlli individuali per abilitazione, testo personalizzato, orari e colori:
Asia (18:00-00:00): Blu di default
London (02:30-05:30): Rosso di default
N.Y. AM (07:00-11:30): Verde di default
Lunch (11:30-13:00): Giallo dorato, abilitata di default
N.Y. PM (13:00-16:00): Viola di default
PDH / PDL
Gestisce i livelli Previous Day High e Previous Day Low:
-Mostra PDH/PDL: Abilita massimo/minimo del giorno precedente
-Estensione: "Fino a Mitigazione" (si ferma quando rotto) o "Candela Più Recente" (continua sempre)
-Colori/Spessore: Personalizzazione visiva delle linee (viola scuro di default, spessore 1px)
-Etichette: Mostra testi "PDH"/"PDL" con colore personalizzabile (bianco di default)
PWH / PWL
Gestisce i livelli Previous Week High e Previous Week Low:
-Mostra PWH/PWL: Abilita massimo/minimo della settimana precedente
-Estensione: Controllo indipendente dell'estensione delle linee
-Colori/Spessore: Arancione di default per entrambi, spessore 2px
-Etichette: Testi "PWH"/"PWL" configurabili
PMH / PML
Gestisce i livelli Previous Month High e Previous Month Low:
-Mostra PMH/PML: Abilita massimo/minimo del mese precedente utilizzando security()
-Estensione: Controllo indipendente come gli altri sistemi
-Colori/Spessore: Blu di default per entrambi, spessore 1px
-Etichette: Testi "PMH"/"PML" personalizzabili
MIDNIGHT PRICE LEVEL
Sistema avanzato per prezzi di mezzanotte multipli:
Controlli Base
-Mostra Midnight Price: Abilita linea al prezzo di chiusura pre-00:00 (strategia ICT)
-Midnight -2/-3 Giorni: Estende il sistema a 2 e 3 giorni precedenti
-Estensione/Mitigazione: "Fino a Mitigazione" o "Candela Più Recente" con modalità "Una Volta" o "Multipla"
Personalizzazione
-Colori separati: D-1, D-2, D-3 con trasparenza progressiva (giallo oro di default)
-Stile/Spessore: Linee personalizzabili (Solida, Punteggiata, Tratteggiata)
-Etichette: Testi configurabili (🌙1, 🌙2, 🌙3) con colori sfondo/testo personalizzabili
-Avvisi: Alert quando mitigati durante killzones attive
KILLZONE LEVEL
Controlla linee pivot e etichette delle killzones:
Controlli Linee
-Mostra Linee: Abilita linee orizzontali sui massimi/minimi delle killzones
-Avvisi Rottura: Alert quando pivot vengono superati
-Punti Medi: Linee tratteggiate al centro del range con opzione di stop dopo mitigazione
-Offset Etichette: Sposta etichette avanti di 5 candele (0-20 configurabile), ricongiungendole quando mitigate
Controlli Etichette
-Personalizzazione Testi: Etichette configurabili per ogni sessione (Asia_H/L, London_H/L, ecc.)
-Sfondo/Colori: Etichette trasparenti o visibili con colori personalizzabili
-Etichette Rotte: Testo aggiuntivo (❌ di default) e colori speciali quando pivot mitigati
-Estensione: "Fino a Mitigazione" o "Oltre Mitigazione" con filtro sessioni ("Più Recente" o "Tutte")
STILI ETICHETTE
Tre sezioni dedicate per personalizzare la forma grafica delle etichette:
-Stili Etichette Linee Killzones: Controlli separati per High/Low delle killzones
-Stili Etichette PDH/PDL: Forme personalizzabili per Previous Day levels
-Stili Etichette PWH/PWL: Forme personalizzabili per Previous Week levels
-Stili Etichette PMH/PML: Forme personalizzabili per Previous Month levels
Ogni sezione offre 15+ opzioni di forma (Frecce, Centro, Cerchio, Quadrato, Diamante, Triangoli, Croci, Bandiere, ecc.)
LINEE MEZZANOTTE
Sistema per linee verticali alle ore 00:00:
-Mostra Linee/Etichette: Linee verticali con etichette freccia verso l'alto
-Personalizzazione: Colore (grigio di default), stile, spessore delle linee verticali
-Etichette: Testo configurabile ("00:00" di default) con colore testo personalizzabile (nero di default)
-Offset Etichette: Controllo percentuale (-10000% a +10000%) per posizionamento verticale
-Estensione: Direzioni configurabili (Nessuna, Sopra, Sotto, Entrambe)
-Limite: Numero massimo linee mantenute (4 di default, max 50)
L'indicatore offre controllo granulare su ogni aspetto visivo e funzionale, rendendo possibile adattarlo a qualsiasi strategia di trading ICT o setup personale.
Midnight 30min High/LowMidnight 30min High/Low — Overnight Liquidity Range Tracker
Capture the Overnight Session: A Strategic Level Identification Tool from Professional Trading Methodology
This indicator captures the high and low prices during the critical 30-minute midnight session (12:00-12:30 AM EST) and projects these levels forward as key support and resistance zones. These overnight ranges often contain significant liquidity and serve as crucial reference points for intraday price action, representing areas where institutional activity may have established important levels.
🔍 What This Script Does:
Identifies Critical Overnight Session Levels
- Automatically detects the 12:00-12:30 AM EST session window
- Captures the highest and lowest prices during this 30-minute period
- Projects these levels forward for multiple trading days
Creates Dynamic Support/Resistance Zones
- Extends midnight high/low levels as horizontal lines with customizable projection periods
- Fills the area between high and low to create a visual trading range
- Updates automatically each trading day with new overnight levels
Provides Clear Visual Reference Points
- Optional session start markers (●) highlight when the midnight session begins
- Color-coded lines distinguish between high and low levels
- Transparent fill area creates an easy-to-identify trading zone
Real-Time Level Tracking
- Updates levels in real-time during the active midnight session
- Maintains historical levels for reference and backtesting
- Compatible with data window for precise level values
⚙️ Customization Options:
Extend Days (1-30):** Control how many days forward the levels are projected (default: 5 days)
High Line Color:** Customize the midnight high line color (default: blue)
Low Line Color:** Customize the midnight low line color (default: orange)
Fill Color:** Adjust the transparency and color of the range area (default: light aqua, 80% transparency)
Show Session Markers:** Toggle yellow session start indicators on/off (default: enabled)
💡 How to Use:
Deploy on lower timeframes (1m-15m) for precise level identification and reaction monitoring**
Watch for key price interactions:
- Rejection at midnight high levels (potential resistance)
- Bounce from midnight low levels (potential support)
- Range-bound trading between the high and low levels
Combine with liquidity concepts:
- Monitor for stop hunts above/below these levels
- Look for false breakouts that snap back into the range
- Use as confluence with other ICT concepts like FVGs and Order Blocks
Strategic Applications:
- Range trading between midnight levels
- Breakout confirmation when price closes decisively outside the range
- Support/resistance validation for entry and exit planning
🔗 Combine With These Tools for Complete Market Structure Analysis:
✅ First FVG — Opening Range Fair Value Gap Detector.
✅ ICT Turtle Soup (Liquidity Reversal)— Spot stop hunts and false breakout scenarios
✅ ICT Macro Zones (Grey Box Version)- It tracks real-time highs and lows for each Silver Bullet session
✅ ICT SMC Liquidity Grabs and OBs- Liquidity Grabs, Order Block Zones, and Fibonacci OTE Levels, allowing traders to identify institutional entry models with clean, rule-based visual signals.
Together, these tools create a comprehensive Smart Money Concepts (SMC) framework — helping traders identify, anticipate, and capitalize on institutional-level price movements with precision and confidence during critical overnight sessions.

NY HIGH LOW BREAKNY HIGH LOW BREAK: A New York Session Breakout Strategy
The "NY HIGH LOW BREAK" indicator is a powerful TradingView script designed to identify and capitalize on breakout opportunities during the New York trading session. This strategy focuses on the initial price action of the New York market open, looking for clear breaches of the high or low established within the first 30 minutes. It's particularly suited for intraday traders who seek to capture momentum-driven moves.
Strategy Logic
The core of the "NY HIGH LOW BREAK" strategy revolves around these key components:
New York Session Opening Range Identification:
The script first identifies the opening range of the New York session. This is defined by the high and low prices established during the first 30 minutes of the New York trading session (from 7:01 AM GMT-4 to 7:31 AM GMT-4).
These crucial levels are then extended forward on the chart as horizontal lines, serving as potential support and resistance zones.
Breakout Signal Generation:
Long Signal: A buy signal is generated when the price breaks above the high of the New York opening range. Specifically, it looks for a candle whose open and close are both above the highLinePrice, and importantly, the previous candle's open was below and close was above the highLinePrice. This indicates a strong upward momentum confirming the breakout.
Short Signal: Conversely, a sell signal is generated when the price breaks below the low of the New York opening range. It looks for a candle whose open and close are both below the lowLinePrice, and the previous candle's open was above and close was below the lowLinePrice. This suggests strong downward momentum confirming the breakdown.
Supertrend Filter (Implicit/Future Enhancement):
While the supertrend and direction variables are present in the code, they are not actively used in the current signal generation logic. This suggests a potential future enhancement where the Supertrend indicator could be incorporated as a trend filter to confirm breakout directions, adding an extra layer of confluence to the signals. For example, only taking long breakouts when Supertrend indicates an uptrend, and short breakouts when Supertrend indicates a downtrend.
Second Candle Confirmation (Possible Future Enhancement):
The close_sec_candle function and openSEC, closeSEC variables indicate an attempt to capture the open and close of a "second candle" (30 minutes after the initial New York open). Currently, closeSEC is used in a specific condition for signal_way but not directly in the primary longSignal or shortSignal logic. This also suggests a potential future refinement where the price action of this second candle could be used for further confirmation or specific entry criteria.
Time-Based Filtering:
Signals are only considered valid within a specific trading window from 8:00 AM GMT-4 to 8:00 AM GMT-4 + 16 * 30 minutes (which is 480 minutes, or 8 hours) on 1-minute and 5-minute timeframes. This ensures that trades are taken during the most active and volatile periods of the New York session, avoiding late-session chop.
The script also highlights the New York session and lunch hours using background colors, providing visual context to the trading day.
Key Features
Automated New York Open Range Detection: The script automatically identifies and plots the high and low of the first 30 minutes of the New York trading session.
Clear Breakout Signals: Visually distinct "BUY" and "SELL" labels appear on the chart when a breakout occurs, making it easy to spot trading opportunities.
Timeframe Adaptability: While optimized for 1-minute and 5-minute timeframes for signal generation, the opening range lines can be displayed on various timeframes.
Customizable Risk-to-Reward (RR): The rr input allows users to define their preferred risk-to-reward ratio for potential trades, although it's not directly implemented in the current signal or trade management logic. This could be used by traders for manual trade management.
Visual Session and Lunch Highlights: The script colors the background to clearly delineate the New York trading session and the lunch break, helping traders understand the market context.
How to Use
Apply the Indicator: Add the "NY HIGH LOW BREAK" indicator to your chart on TradingView.
Select a Relevant Timeframe: For optimal signal generation, use 1-minute or 5-minute timeframes.
Observe the Opening Range: The green and red lines represent the high and low of the first 30 minutes of the New York session.
Look for Breakouts: Wait for price to decisively break above the green line (for a buy) or below the red line (for a sell).
Confirm Signals: The "BUY" or "SELL" labels will appear on the chart when the breakout conditions are met within the active trading window.
Implement Your Risk Management: Use your preferred risk management techniques, including stop-loss and take-profit levels, in conjunction with the signals generated. The rr input can guide your manual risk-to-reward calculations.
Potential Enhancements & Considerations
Supertrend Confirmation: Integrating the supertrend variable to filter signals would significantly enhance the strategy's robustness by aligning trades with the prevailing trend.
Stop-Loss and Take-Profit Automation: The rr input currently serves as a manual guide. Future versions could integrate automated stop-loss and take-profit placement based on this ratio, potentially using ATR for dynamic sizing.
Volume Confirmation: Adding a volume filter to confirm breakouts would ensure that only high-conviction moves are traded.
Backtesting and Optimization: Thorough backtesting across various assets and market conditions is crucial to determine the optimal settings and profitability of this strategy.
Session Times: The current session times are hardcoded. Making these user-definable inputs would allow for greater flexibility across different time zones and trading preferences.
The "NY HIGH LOW BREAK" is a straightforward yet effective strategy for capturing initial New York session momentum. By focusing on clear breakout levels, it aims to provide timely and actionable trading signals for intraday traders.

Previous 2 Days High/LowCan you give me a summary of this indicator
The "Previous 2 Days High/Low" indicator, written in Pine Script v5 for TradingView, plots horizontal lines representing the combined high and low prices of the previous two trading days on a chart. Here's a summary of its functionality, purpose, and key features:
Purpose
The indicator helps traders identify significant price levels by displaying the highest high and lowest low from the previous two days, which can act as potential support or resistance levels. These levels are plotted as lines that extend across the current trading day, making it easier to visualize key price zones for trading decisions.
Key Features
Calculates Combined High and Low:
Retrieves the high and low prices of the previous day and the day before using request.security on the daily timeframe ("D").
Computes the combined high as the maximum of the two days' highs and the combined low as the minimum of the two days' lows.
Dynamic Line Plotting:
Draws two horizontal lines:
Red Line: Represents the combined high, plotted at the highest price of the previous two days.
Green Line: Represents the combined low, plotted at the lowest price of the previous two days.
Lines are created at the start of a new trading day and extended to the right edge of the chart using line.set_x2, ensuring they span the entire current day.
Labels for Clarity:
Adds labels to the right of the chart, displaying the exact price values of the combined high ("Combined High: ") and combined low ("Combined Low: ").
Labels are updated to move with the lines, maintaining alignment at the current bar.
Clutter Prevention:
Deletes old lines and labels at the start of each new trading day to avoid overlapping or excessive objects on the chart.
Dynamic Requests:
Uses dynamic_requests=true in the indicator() function to allow request.security calls within conditional blocks (if ta.change(time("D"))), enabling daily data retrieval within the script's logic.
Previous Daily High/LowThe previous day’s high and low are critical price levels that traders use to identify potential support, resistance, and intraday trading opportunities. These levels represent the highest and lowest prices reached during the prior trading session and often act as reference points for future price action.
Why Are Previous Daily High/Low Important?
Support & Resistance Zones
The previous day’s low often acts as support (buyers defend this level).
The previous day’s high often acts as resistance (sellers defend this level).
Breakout Trading
A move above the previous high suggests bullish momentum.
A move below the previous low suggests bearish momentum.
Mean Reversion Trading
Traders fade moves toward these levels, expecting reversals.
Example: Buying near the previous low in an uptrend.
Institutional Order Flow
Market makers and algos often reference these levels for liquidity.
How to Use Previous Daily High/Low in Trading
1. Breakout Strategy
Long Entry: Price breaks & closes above previous high → bullish continuation.
Short Entry: Price breaks & closes below previous low → bearish continuation.
2. Reversal Strategy
Long at Previous Low: If price pulls back to the prior day’s low in an uptrend.
Short at Previous High: If price rallies to the prior day’s high in a downtrend.
3. Range-Bound Markets
Buy near previous low, sell near previous high if price oscillates between them.
Example Trade Setup
Scenario: Price opens near the previous day’s high.
Bullish Case: A breakout above it targets next resistance.
Bearish Case: Rejection at the high signals a pullback.

Killzones & Previous High-Low Liquidity [odnac]This indicator is designed for use in intraday trading to visualize key "Killzones" (specific time windows during different global market sessions) and highlight liquidity levels based on previous highs and lows from the previous day and week.
It helps traders identify potential market entry and exit points based on time-based trading zones and price action levels.
Key Features:
Killzone (Market Session Timeframes):
Asia (2000-0000 UTC): Displays a shaded box over the Asia trading session.
Europe (0200-0500 UTC): Highlights the European trading session.
New York AM (0830-1100 UTC): Represents the morning session of the NY market.
New York PM (1330-1600 UTC): Represents the afternoon session of the NY market.
Each of these timeframes can be customized in terms of session start and end times, and the shaded areas will help identify high liquidity periods when the market tends to be more active.
Previous High-Low Liquidity Zones:
Previous Week's High/Low: Displays lines at the high and low of the previous week.
These are important liquidity levels that can influence price action.
Previous Day's High/Low: Shows the high and low from the previous trading day.
These are also significant levels to watch for potential support and resistance.
Filters and Customization:
Position Filtering: The indicator allows users to filter out previous highs or lows if the current price doesn't align with those levels.
For example, it can filter out previous week highs if the current price is lower than that level.
Vertical Lines: Optional vertical lines to highlight key time points such as the start and end of the previous week and day.
How It Works:
The indicator visually draws "killzones" as shaded regions on the chart, indicating periods of increased market activity.
This can help traders align their strategies with the most liquid periods of the day.
The previous high and low lines (both for the previous week and the previous day) are drawn as solid lines and can be toggled on/off in the settings.
Labels are added to indicate the specific levels and periods.
The indicator provides clear visual cues, helping traders assess if the price is near important liquidity levels and whether the current market conditions align with those levels.
Customizable Settings:
You can control whether each Killzone and liquidity level is shown on the chart.
Color customization for the various zones and lines is also available.
The indicator also lets you decide whether to hide weekend data, set time-frame limits, and choose whether or not to show vertical lines at the beginning and end of each trading session.
This indicator is aimed at traders who want to trade based on high-liquidity periods and understand where key support and resistance levels are likely to emerge based on previous price action.

Pivot Points High Low - JVersion**Indicator Name**: Pivot Points High Low (Without Price Labels)
**Overview**
The Pivot Points High Low indicator is designed to identify and mark local highs and lows (or “pivot” points) on a price chart. Unlike other pivot-based indicators that label each pivot with its exact price, this version displays only small circular markers—removing clutter and focusing attention on the pivot locations themselves.
**Key Features**
1. **Pivot Detection**
- The script uses TradingView’s built-in `ta.pivothigh()` and `ta.pivotlow()` functions to determine when the market has formed a pivot high or pivot low.
- You can define how many bars to the left and right are required to confirm a pivot, helping you tailor the indicator to different market conditions and timeframes.
2. **Clean Markers**
- Each confirmed pivot high or low is represented by a circle placed precisely on the candle where the pivot is detected.
- No numeric labels are shown, keeping your chart visually uncluttered while still highlighting important turning points in price.
3. **Customization**
- **Left/Right Pivot Length**: Choose how many bars to the left and right must be lower (for highs) or higher (for lows) to validate a pivot. Larger values mean fewer but more significant pivots; smaller values mean more frequent pivots.
- **Marker Colors**: Independently customize the colors of the high-marker circles and low-marker circles to easily distinguish between local tops and bottoms.
4. **Usage and Interpretation**
- **Identifying Reversals**: As soon as a circle appears at a local high or low, it may indicate a short-term trend reversal or the beginning of a new swing in price.
- **Combine with Other Tools**: Pivot points are more informative when used alongside broader trend analysis, support/resistance identification, or other momentum indicators.
- **Adjusting Sensitivity**: By increasing or decreasing the left/right pivot lengths, you can make the indicator more or less sensitive to small market fluctuations.
5. **Practical Tips**
- **Swing Trading**: Shorter lengths can be used by swing traders looking for quick reversals in lower timeframes.
- **Longer-Term Trends**: Larger lengths are better for position traders or those who prefer to see only major turning points in the market.
- **Clean Chart Layout**: Because text labels are removed, you can visually focus on the circles—especially helpful if you use multiple indicators and prefer a less cluttered chart.
---
By pinpointing local highs and lows without price labels, the **Pivot Points High Low** indicator keeps charts neat yet informative, allowing traders to quickly recognize potential turning points in the market and make more informed decisions.
Previous Day and Current Day High/LowKey Features:
Previous Day High and Low Lines:
Displays the high (PDH) and low (PDL) levels of the previous trading day.
Allows customization of line colors, styles (solid, dashed, or dotted), and widths.
Extends these lines by a specified number of candles into the current day for better visualization.
Current Day High and Low Lines:
Displays the high (CDH) and low (CDL) levels during the current day's regular trading hours.
Customizable line attributes, including color, style, width, and extension length.
Customizable Input Options:
User-configurable settings for both the previous and current day high/low lines, grouped under respective sections for clarity.
Regular trading hours can be defined manually (default is 9:30 AM to 4:00 PM).
Ability to toggle the visibility of the lines for both the previous and current days.
Automatic Reset at the Start of a New Day:
Captures the high and low values of the completed day and resets for the new day.
Deletes old lines and labels to ensure clarity and avoid overlap.
Dynamic Updates:
Updates the current day's high and low lines and labels as new data comes in.
Adjusts previous day lines dynamically based on the user-defined number of candles to extend.
Session-Based Filtering:
Ensures the calculations and updates are restricted to the defined regular trading hours.
Code Logic:
Input Groups: The script uses grouped inputs to allow users to configure settings for previous and current day levels separately.
Line and Label Management: It creates and deletes lines and labels dynamically to prevent clutter and keep the chart organized.
Session Check: Uses the session input to determine if a bar falls within regular trading hours.
High/Low Calculation: Tracks the high and low for both the previous and current days during regular trading hours.
New Day Detection: Identifies the start of a new trading day to update previous day values and reset current day variables.
Applications:
Intraday Trading: Helps traders identify critical support and resistance levels from the previous and current days.
Trend Analysis: Provides visual cues for price movement trends across consecutive days.
Custom Visualization: With extensive customization options, traders can adapt the indicator to suit their trading style and chart aesthetics.
This script is highly configurable, making it versatile for a wide range of trading strategies and styles.

Heikin Ashi & Swing Highs/LowsHeikin Ashi & Swing Highs/Lows
Indicator Description:
The "Heikin Ashi & Swing Highs/Lows" indicator combines Heikin Ashi candle analysis with the identification of significant swing highs and lows on the chart. This indicator is useful for traders looking to spot trend changes and key points in the market.
Key Features:
Heikin Ashi:
Calculation and Visualization: Utilizes the Heikin Ashi method to smooth out the candlestick chart, helping to visualize trends and reduce market noise. Heikin Ashi candles are calculated from the standard candles (Open, High, Low, Close) and are displayed on the chart with a green color for bullish signals and red for bearish signals.
Vertical Offset Adjustment: Provides options to adjust the vertical offset of the candles based on the selected timeframe, with specific adjustments for short, medium, long, and super-long periods.
Swing Highs/Lows:
Key Point Identification: Marks significant swing highs and lows on the chart using a configurable period. Swing highs are displayed in red and swing lows in green.
Candlestick Patterns: Detects and labels common candlestick patterns such as:
Hammer: A bullish candlestick pattern with a small body and a long lower wick.
Inverted Hammer: Similar to the Hammer, but with a long upper wick.
Bullish Engulfing: A two-candle pattern where a bullish candle completely engulfs a previous bearish candle.
Hanging Man: A bearish pattern with a small body and a long lower wick, appearing at the end of an uptrend.
Shooting Star: A bearish pattern with a small body and a long upper wick, appearing at the end of an uptrend.
Bearish Engulfing: A two-candle pattern where a bearish candle completely engulfs a previous bullish candle.
Settings:
Timeframe: Allows you to select the desired timeframe to adjust the Heikin Ashi candle analysis.
Vertical Offset: Customize the vertical offset of Heikin Ashi candles based on the selected timeframe.
Swing Point Style: Configure the colors of the significant swing highs and lows on the chart.
Recommended Use:
This indicator is ideal for traders looking for a clear representation of trends through Heikin Ashi candles and who want to identify key reversal points in the market by detecting swing highs/lows and candlestick patterns.
Benefits:
Facilitates the identification of smooth trends and trend reversals.
Provides a clear visual representation of critical market points.
Helps traders recognize important candlestick patterns that may indicate changes in market direction.

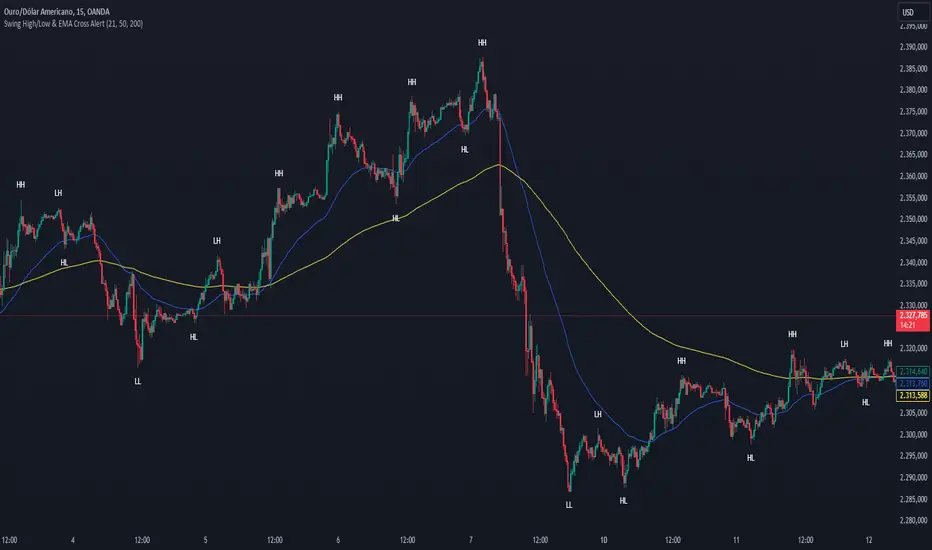
Swing High/Low & EMA Cross AlertScript Description:
This script on TradingView combines the detection of Swing High/Low points with exponential moving average (EMA) crossovers to provide buy and sell alerts and to mark swing points on the chart.
What the Script Does:
Swing High/Low Detection:
Uses the ta.pivothigh function to detect significant high points and the ta.pivotlow function to detect significant low points.
For each detected point, the script checks if it is a new higher high (HH) or lower high (LH) for the highs, and a new lower low (LL) or higher low (HL) for the lows.
Creates visual labels to identify these points on the chart, helping traders to visualize potential reversal points.
EMA Crossover:
Calculates two EMAs: a fast EMA (fastEMA) with a default period of 50 and a slow EMA (slowEMA) with a default period of 200.
Detects bullish crossovers (when fastEMA crosses above slowEMA) and bearish crossunders (when fastEMA crosses below slowEMA).
Generates buy and sell alerts based on these crossovers.
How the Script Works:
EMA Calculation: EMAs are calculated using the closing prices and user-defined periods.
Swing High/Low Detection: Uses the high and low values from the previous length bars to determine the swing points.
Alert Generation: Alerts are triggered when crossovers between the EMAs occur.
How to Use the Script:
Add to Chart: Insert the script into TradingView and apply it to the desired chart.
Configure Parameters:
Adjust the detection period for swing points (length).
Configure the periods for the EMAs (fastLen and slowLen).
Customize the colors for the swing point labels as per your preference.
Monitor Alerts: Use the EMA crossover alerts to make buy or sell decisions. Observe the swing point labels to identify potential trend reversals.
Justification for the Combination:
EMAs: Widely used to identify trend direction. Combining a fast EMA with a slow EMA helps capture both short-term and long-term trend changes.
Swing High/Low: Identifies reversal points in price, which are crucial for determining potential entry and exit points in trades.
Combination:
Combining EMAs and Swing High/Low provides a comprehensive view of price behavior, helping traders to effectively identify trends and reversal points.
This script is useful for traders who want to combine trend analysis (via EMAs) with the identification of reversal points (Swing High/Low), providing a more complete view of price behavior on the chart.
GKD-C Blau Composite High-Low Momentum [Loxx]Giga Kaleidoscope GKD-C Blau Composite High-Low Momentum is a Confirmation module included in Loxx's "Giga Kaleidoscope Modularized Trading System".
█ Giga Kaleidoscope Modularized Trading System
What is Loxx's "Giga Kaleidoscope Modularized Trading System"?
The Giga Kaleidoscope Modularized Trading System is a trading system built on the philosophy of the NNFX (No Nonsense Forex) algorithmic trading.
What is the NNFX algorithmic trading strategy?
The NNFX (No-Nonsense Forex) trading system is a comprehensive approach to Forex trading that is designed to simplify the process and remove the confusion and complexity that often surrounds trading. The system was developed by a Forex trader who goes by the pseudonym "VP" and has gained a significant following in the Forex community.
The NNFX trading system is based on a set of rules and guidelines that help traders make objective and informed decisions. These rules cover all aspects of trading, including market analysis, trade entry, stop loss placement, and trade management.
Here are the main components of the NNFX trading system:
1. Trading Philosophy: The NNFX trading system is based on the idea that successful trading requires a comprehensive understanding of the market, objective analysis, and strict risk management. The system aims to remove subjective elements from trading and focuses on objective rules and guidelines.
2. Technical Analysis: The NNFX trading system relies heavily on technical analysis and uses a range of indicators to identify high-probability trading opportunities. The system uses a combination of trend-following and mean-reverting strategies to identify trades.
3. Market Structure: The NNFX trading system emphasizes the importance of understanding the market structure, including price action, support and resistance levels, and market cycles. The system uses a range of tools to identify the market structure, including trend lines, channels, and moving averages.
4. Trade Entry: The NNFX trading system has strict rules for trade entry. The system uses a combination of technical indicators to identify high-probability trades, and traders must meet specific criteria to enter a trade.
5. Stop Loss Placement: The NNFX trading system places a significant emphasis on risk management and requires traders to place a stop loss order on every trade. The system uses a combination of technical analysis and market structure to determine the appropriate stop loss level.
6. Trade Management: The NNFX trading system has specific rules for managing open trades. The system aims to minimize risk and maximize profit by using a combination of trailing stops, take profit levels, and position sizing.
Overall, the NNFX trading system is designed to be a straightforward and easy-to-follow approach to Forex trading that can be applied by traders of all skill levels.
Core components of an NNFX algorithmic trading strategy
The NNFX algorithm is built on the principles of trend, momentum, and volatility. There are six core components in the NNFX trading algorithm:
1. Volatility - price volatility; e.g., Average True Range, True Range Double, Close-to-Close, etc.
2. Baseline - a moving average to identify price trend
3. Confirmation 1 - a technical indicator used to identify trends
4. Confirmation 2 - a technical indicator used to identify trends
5. Continuation - a technical indicator used to identify trends
6. Volatility/Volume - a technical indicator used to identify volatility/volume breakouts/breakdown
7. Exit - a technical indicator used to determine when a trend is exhausted
What is Volatility in the NNFX trading system?
In the NNFX (No Nonsense Forex) trading system, ATR (Average True Range) is typically used to measure the volatility of an asset. It is used as a part of the system to help determine the appropriate stop loss and take profit levels for a trade. ATR is calculated by taking the average of the true range values over a specified period.
True range is calculated as the maximum of the following values:
-Current high minus the current low
-Absolute value of the current high minus the previous close
-Absolute value of the current low minus the previous close
ATR is a dynamic indicator that changes with changes in volatility. As volatility increases, the value of ATR increases, and as volatility decreases, the value of ATR decreases. By using ATR in NNFX system, traders can adjust their stop loss and take profit levels according to the volatility of the asset being traded. This helps to ensure that the trade is given enough room to move, while also minimizing potential losses.
Other types of volatility include True Range Double (TRD), Close-to-Close, and Garman-Klass
What is a Baseline indicator?
The baseline is essentially a moving average, and is used to determine the overall direction of the market.
The baseline in the NNFX system is used to filter out trades that are not in line with the long-term trend of the market. The baseline is plotted on the chart along with other indicators, such as the Moving Average (MA), the Relative Strength Index (RSI), and the Average True Range (ATR).
Trades are only taken when the price is in the same direction as the baseline. For example, if the baseline is sloping upwards, only long trades are taken, and if the baseline is sloping downwards, only short trades are taken. This approach helps to ensure that trades are in line with the overall trend of the market, and reduces the risk of entering trades that are likely to fail.
By using a baseline in the NNFX system, traders can have a clear reference point for determining the overall trend of the market, and can make more informed trading decisions. The baseline helps to filter out noise and false signals, and ensures that trades are taken in the direction of the long-term trend.
What is a Confirmation indicator?
Confirmation indicators are technical indicators that are used to confirm the signals generated by primary indicators. Primary indicators are the core indicators used in the NNFX system, such as the Average True Range (ATR), the Moving Average (MA), and the Relative Strength Index (RSI).
The purpose of the confirmation indicators is to reduce false signals and improve the accuracy of the trading system. They are designed to confirm the signals generated by the primary indicators by providing additional information about the strength and direction of the trend.
Some examples of confirmation indicators that may be used in the NNFX system include the Bollinger Bands, the MACD (Moving Average Convergence Divergence), and the MACD Oscillator. These indicators can provide information about the volatility, momentum, and trend strength of the market, and can be used to confirm the signals generated by the primary indicators.
In the NNFX system, confirmation indicators are used in combination with primary indicators and other filters to create a trading system that is robust and reliable. By using multiple indicators to confirm trading signals, the system aims to reduce the risk of false signals and improve the overall profitability of the trades.
What is a Continuation indicator?
In the NNFX (No Nonsense Forex) trading system, a continuation indicator is a technical indicator that is used to confirm a current trend and predict that the trend is likely to continue in the same direction. A continuation indicator is typically used in conjunction with other indicators in the system, such as a baseline indicator, to provide a comprehensive trading strategy.
What is a Volatility/Volume indicator?
Volume indicators, such as the On Balance Volume (OBV), the Chaikin Money Flow (CMF), or the Volume Price Trend (VPT), are used to measure the amount of buying and selling activity in a market. They are based on the trading volume of the market, and can provide information about the strength of the trend. In the NNFX system, volume indicators are used to confirm trading signals generated by the Moving Average and the Relative Strength Index. Volatility indicators include Average Direction Index, Waddah Attar, and Volatility Ratio. In the NNFX trading system, volatility is a proxy for volume and vice versa.
By using volume indicators as confirmation tools, the NNFX trading system aims to reduce the risk of false signals and improve the overall profitability of trades. These indicators can provide additional information about the market that is not captured by the primary indicators, and can help traders to make more informed trading decisions. In addition, volume indicators can be used to identify potential changes in market trends and to confirm the strength of price movements.
What is an Exit indicator?
The exit indicator is used in conjunction with other indicators in the system, such as the Moving Average (MA), the Relative Strength Index (RSI), and the Average True Range (ATR), to provide a comprehensive trading strategy.
The exit indicator in the NNFX system can be any technical indicator that is deemed effective at identifying optimal exit points. Examples of exit indicators that are commonly used include the Parabolic SAR, the Average Directional Index (ADX), and the Chandelier Exit.
The purpose of the exit indicator is to identify when a trend is likely to reverse or when the market conditions have changed, signaling the need to exit a trade. By using an exit indicator, traders can manage their risk and prevent significant losses.
In the NNFX system, the exit indicator is used in conjunction with a stop loss and a take profit order to maximize profits and minimize losses. The stop loss order is used to limit the amount of loss that can be incurred if the trade goes against the trader, while the take profit order is used to lock in profits when the trade is moving in the trader's favor.
Overall, the use of an exit indicator in the NNFX trading system is an important component of a comprehensive trading strategy. It allows traders to manage their risk effectively and improve the profitability of their trades by exiting at the right time.
How does Loxx's GKD (Giga Kaleidoscope Modularized Trading System) implement the NNFX algorithm outlined above?
Loxx's GKD v1.0 system has five types of modules (indicators/strategies). These modules are:
1. GKD-BT - Backtesting module (Volatility, Number 1 in the NNFX algorithm)
2. GKD-B - Baseline module (Baseline and Volatility/Volume, Numbers 1 and 2 in the NNFX algorithm)
3. GKD-C - Confirmation 1/2 and Continuation module (Confirmation 1/2 and Continuation, Numbers 3, 4, and 5 in the NNFX algorithm)
4. GKD-V - Volatility/Volume module (Confirmation 1/2, Number 6 in the NNFX algorithm)
5. GKD-E - Exit module (Exit, Number 7 in the NNFX algorithm)
(additional module types will added in future releases)
Each module interacts with every module by passing data between modules. Data is passed between each module as described below:
GKD-B => GKD-V => GKD-C(1) => GKD-C(2) => GKD-C(Continuation) => GKD-E => GKD-BT
That is, the Baseline indicator passes its data to Volatility/Volume. The Volatility/Volume indicator passes its values to the Confirmation 1 indicator. The Confirmation 1 indicator passes its values to the Confirmation 2 indicator. The Confirmation 2 indicator passes its values to the Continuation indicator. The Continuation indicator passes its values to the Exit indicator, and finally, the Exit indicator passes its values to the Backtest strategy.
This chaining of indicators requires that each module conform to Loxx's GKD protocol, therefore allowing for the testing of every possible combination of technical indicators that make up the six components of the NNFX algorithm.
What does the application of the GKD trading system look like?
Example trading system:
Backtest: Strategy with 1-3 take profits, trailing stop loss, multiple types of PnL volatility, and 2 backtesting styles
Baseline: Hull Moving Average
Volatility/Volume: Hurst Exponent
Confirmation 1: Blau Composite High-Low Momentum as shown on the chart above
Confirmation 2: Williams Percent Range
Continuation: Fisher Transform
Exit: Rex Oscillator
Each GKD indicator is denoted with a module identifier of either: GKD-BT, GKD-B, GKD-C, GKD-V, or GKD-E. This allows traders to understand to which module each indicator belongs and where each indicator fits into the GKD protocol chain.
Giga Kaleidoscope Modularized Trading System Signals (based on the NNFX algorithm)
Standard Entry
1. GKD-C Confirmation 1 Signal
2. GKD-B Baseline agrees
3. Price is within a range of 0.2x Volatility and 1.0x Volatility of the Goldie Locks Mean
4. GKD-C Confirmation 2 agrees
5. GKD-V Volatility/Volume agrees
Baseline Entry
1. GKD-B Baseline signal
2. GKD-C Confirmation 1 agrees
3. Price is within a range of 0.2x Volatility and 1.0x Volatility of the Goldie Locks Mean
4. GKD-C Confirmation 2 agrees
5. GKD-V Volatility/Volume agrees
6. GKD-C Confirmation 1 signal was less than 7 candles prior
Continuation Entry
1. Standard Entry, Baseline Entry, or Pullback; entry triggered previously
2. GKD-B Baseline hasn't crossed since entry signal trigger
3. GKD-C Confirmation Continuation Indicator signals
4. GKD-C Confirmation 1 agrees
5. GKD-B Baseline agrees
6. GKD-C Confirmation 2 agrees
1-Candle Rule Standard Entry
1. GKD-C Confirmation 1 signal
2. GKD-B Baseline agrees
3. Price is within a range of 0.2x Volatility and 1.0x Volatility of the Goldie Locks Mean
Next Candle:
1. Price retraced (Long: close < close or Short: close > close )
2. GKD-B Baseline agrees
3. GKD-C Confirmation 1 agrees
4. GKD-C Confirmation 2 agrees
5. GKD-V Volatility/Volume agrees
1-Candle Rule Baseline Entry
1. GKD-B Baseline signal
2. GKD-C Confirmation 1 agrees
3. Price is within a range of 0.2x Volatility and 1.0x Volatility of the Goldie Locks Mean
4. GKD-C Confirmation 1 signal was less than 7 candles prior
Next Candle:
1. Price retraced (Long: close < close or Short: close > close )
2. GKD-B Baseline agrees
3. GKD-C Confirmation 1 agrees
4. GKD-C Confirmation 2 agrees
5. GKD-V Volatility/Volume Agrees
PullBack Entry
1. GKD-B Baseline signal
2. GKD-C Confirmation 1 agrees
3. Price is beyond 1.0x Volatility of Baseline
Next Candle:
1. Price is within a range of 0.2x Volatility and 1.0x Volatility of the Goldie Locks Mean
3. GKD-C Confirmation 1 agrees
4. GKD-C Confirmation 2 agrees
5. GKD-V Volatility/Volume Agrees
█ GKD-C Blau Composite High-Low Momentum
What is the Blau Composite High-Low Momentum?
The Composite High/Low Momentum (HLM) Blau HLM is a technical analysis tool that is used to analyze the momentum of a financial instrument. Developed by William Blau, the HLM is a unique indicator that combines both price and volume data to provide a comprehensive picture of market trends and momentum.
The HLM is based on the concept of price momentum, which is the tendency of a financial instrument to continue moving in the same direction that it has been moving. Momentum is a key indicator for traders, as it can help to identify trends and potential changes in trend.
The HLM is calculated by comparing the current price of a financial instrument to its highest and lowest prices over a specified period of time. This calculation is then combined with a measure of volume, which is used to provide additional insight into market trends and momentum.
The HLM is designed to be highly responsive to changes in market conditions, providing traders with a more accurate and timely picture of market trends. The indicator is also highly customizable, allowing traders to adjust the parameters to suit their individual trading styles and preferences.
One of the key benefits of the HLM is its ability to provide early warning signs of potential trend changes. By analyzing both price and volume data, the HLM is able to identify shifts in market momentum that may indicate a potential reversal in trend.
Overall, the Composite High/Low Momentum Blau HLM is a powerful technical analysis tool that can provide traders with valuable insights into market trends and momentum. While it may require some knowledge of technical analysis to use effectively, the HLM can be a valuable tool for traders looking to make informed trading decisions.
Requirements
Inputs
Confirmation 1 and Solo Confirmation: GKD-V Volatility / Volume indicator
Confirmation 2: GKD-C Confirmation indicator
Outputs
Confirmation 2 and Solo Confirmation Complex: GKD-E Exit indicator
Confirmation 1: GKD-C Confirmation indicator
Continuation: GKD-E Exit indicator
Solo Confirmation Simple: GKD-BT Backtest strategy
Additional features will be added in future releases.

TR High-LowDraw a ZigZag line, a trend line , a High-Low line, and two Fibonacci lines.
1. draw ZigZag line
1-1. detect High-Low value
1-2. High-Low value is saved as a provisional value when it is updated
1-3. checks if the provisional value reaches the specified price difference (Difference) when the specified length (High-Low length) is reached
1-4. if the provisional value reaches the specified price difference (Difference), it is officially saved as a High-Low value
1-5. if the provisional value has not reached the specified price difference (Difference), it checks if the price difference (Difference) is reached
for the specified number of extensions (Extension). If it does, the provisional value is officially saved as a High-Low value.
Even if the price difference is not reached and the number of extensions has been reached, the provisional value is officially saved as the High-Low value.
1-6. draw a ZigZag line connecting the detected High-Low values
2. draw a horizontal line
2-1. draw a horizontal line on the High-Low value detected when drawing the ZigZag line
3. Draw a trend line
3-1. Draws a trend line using the High-Low value detected when drawing a ZigZag line
4. Draw a Fibonacci line
4-1. draws a Fibonacci line based on the first and second from the end of the ZigZag line by default
Zig Zag High-Low + RSIThis indicator adds to the functionality of Tr0sT's Zig Zag High Low Indicator by adding the RSI value above the higher-high to eyeball whether the current trend (signified by consecutive higher-highs and higher lows or consecutive lower highs and lower lows) is strengthening or weakening.
THEORY / METHODOLOGY:
If the uptrend is strong, the later pivot high will have a greater RSI number than the previous pivot high indicating an opportunity to go long. In a downtrend the lower high should have a lower RSI than the previous lower high indicating an opportunity to go short. If it does not, it is an indication that the trend is weakening.
ACTION:
If the ZigZag has higher highs and Higher lows and a strengthening RSI, look for Long opportunities on the lower time frame. If the ZigZag has lower highs and lower lows and a weakening RSI, look for Short opportunities on the lower time frame.
USAGE:
This methodology works best and produces the most opportunities when the markets are active, i.e. between 6AM-11AM EST
Thanks to Tr0sT for the original ZigZag High-Low indicator.
Tr0sT: www.tradingview.com
Zig Zag High Low Indicator:
MTF Liquidity Levels Pro (D/W/M) [SmartFoxy]✅ SCRIPT DESCRIPTION (Premium MTF High-Low Levels)
Overview
This indicator automatically plots key High/Low levels across three major timeframes:
Daily (D) , Weekly (W) , and Monthly (M) .
It includes:
• Current period highs/lows (DH/DL, WH/WL, MH/ML);
• Previous period highs/lows (PDH/PDL, PWH/PWL, PMH/PML);
• Open levels (Day Open, Day True Open, Week Open, Month Open);
• Visual elements such as separators, period boxes, labels, and price markers;
• A fully customizable breakout alert system .
The indicator is designed for precise market structure analysis with a focus on liquidity, MTF mechanics, and clean price action.
________________________________________
How It Works
The script tracks historical High/Low levels on each timeframe and displays:
✅ Current High/Low Levels :
Daily;
Weekly;
Monthly.
✅ Previous High/Low levels from the previous day, week, and month:
PDH / PDL;
PWH / PWL;
PMH / PML.
You can select how many previous levels to display (1, 2, 3…).
✅ Open Levels:
Day Open;
Week Open;
Month Open.
Includes optional True Day Open with time offset.
✅ Visual Period Boxes highlighting each session (Day Box, Week Box, Month Box) to help identify intraday and intraperiod structure.
✅ Vertical Separators for the start of each day, week, and month.
✅ Customizable Labels & Price Markers with positions, sizes, and optional price display.
________________________________________
Alerts
A flexible alert module is built in:
✅ Breakout of Any Previous Level (D/W/M) •➤ Triggers when price breaks any previous High/Low:
PDH/PDL;
PWH/PWL;
PMH/PML.
✅ Breakout of Previous Level 1 (D/W/M) •➤ Triggers only for the closest previous levels:
PDH1/PDL1;
PWH1/PWL1;
PMH1/PML1.
✅ Custom Breakout •➤ Choose a specific level:
PDH / PDL;
PWH / PWL;
PMH / PML.
and select which level number (1, 2, 3…) the alert should track.
________________________________________
How to Use
Select which timeframes (D/W/M) to display.
Choose how many previous levels to plot.
Enable Open, Boxes, Separators, or Labels as needed.
Enable True Day Open with offset if required.
Activate Alerts and choose the breakout logic:
• All previous levels;
• Only the nearest level;
• Custom level selection.
Create an alert in TradingView using “Any alert() function call”.
________________________________________
Why This Indicator Is Useful
✅ Instantly reveals key High/Low liquidity zones across multiple timeframes
✅ Helps synchronize market structure across D/W/M levels
✅ Useful for identifying impulses, breakouts, reversals, and liquidity runs
✅ Highlights levels price frequently revisits
✅ Eliminates the need for additional MTF tools
✅ Alerts automate breakout detection for both intraday and swing traders
Suitable for all markets : Forex, Crypto, Indices, Stocks, Futures.

Interval Highlighter with High/Low AlertsInterval Highlighter with High/Low Alerts
Overview:
This Pine Script indicator enhances chart analysis by highlighting specific time intervals and marking the highest and lowest prices within those periods. It supports three customizable modes:
Date Range: Highlight a user-defined period with background shading and plot the highest and lowest prices.
Days of the Week: Highlight specific weekdays with background colors and plot the highest and lowest prices for each day.
Intraday Interval: Highlight a specific intraday time range (e.g., 12:30 PM to 4:30 PM) with background shading and plot the highest and lowest prices within that interval.
Alerts are triggered when the price touches any of the highlighted high or low levels, providing real-time notifications for potential trading opportunities.
High and low lines extend to the right and remain visible after the interval ends. This ensures they act as actionable reference points for alerts between intervals, allowing users to monitor critical levels until a new interval of the same category forms.
Features:
Customizable Time Intervals: Define specific date ranges, weekdays, or intraday intervals to highlight on the chart.
High/Low Tracking: Automatically plots the highest and lowest prices within the defined intervals.
Real-Time Alerts: Set up alerts to notify when the price touches any of the highlighted high or low levels.
Actionable Lines: High/low lines remain visible after interval completion to serve as reference points for alerts.
Visual Enhancements: Customize background colors and line styles for each interval type.
Usage:
Apply the indicator to your chart.
Configure the desired modes (Date Range, Days of the Week, Intraday Interval) in the settings.
Customize the appearance settings to match your preferences.
Set up alerts based on the highlighted high/low levels.
Disclaimer:
This indicator is designed to assist in identifying potential areas of interest based on historical high and low levels within specified intervals. It is not intended as a standalone trading signal. Users should employ additional technical analysis tools and conduct thorough research before making trading decisions.
